What is the difference between System Trace, Developer Trace and System Log in SAP ?

ST01 – System Trace which will be required when you want to record trace for system

ST05 – Performance Trace (Developer Trace) which is required when any userComplaining for a long transaction and you want to record all activity of Transaction.

SM21 – System log is for the recent logs for your CI and application server. What ever happen in SAP it will write a system log.
Path:/usr/sap/<SID>/<Instance>/work/dev_disp

System Trace: If you want to record the internal SAP system activities, use the function SAP System Trace. Recording the processes in your application server enables you to monitor the system and facilitates troubleshooting.

Developer Trace: Developer traces contain technical information for use in the event of problems with your system. Using the entries in the developer traces requires a sophisticated knowledge of the host systems in which your SAP system is running and of the SAP system itself.

System Log: You can use the log to pinpoint and correct errors occurring in your system and its environment.

To work with system logs, choose Tools -> Administration from the R/3 initial screen. When the System Administration initial screen appears, choose Monitoring -> System log. Alternatively, you can choose Test -> System log from the ABAP/4 Development Workbench initial screen.

How to run transaction st05 to trace a program, transaction or user execution

PURPOSE

Learn how to use transaction st05 to trace a program/transaction or just transaction or you just to know what is this a process executing at database level

OVERVIEW

SQL trace(ST05) provides the developer the ability to analyse database select statements.

This is transaction st05 main screen

1.PNG

You cannot run two st05 at the same time. To be able to start st05 you should see “all traces are switched off”

We are  going to expalain how to use st05 with a practical example. Imagine that you are having performance problems  with ZM08 transaction or you just want to know what is this transaction executing at database level

HOW TO START/ACTIVATE ST05 TRANSACTION

To start/activate st05 trace we have to choose “select trace” that is the type of trace based on our perform requirements. Most of times we only use “SQL Trace” . Then we click “Activate Trace with Filter” button
2

This new window will appear

3

we can choose between three principal filters: “User Name”, “Transaction Name” or “Program Name”

It would be possible to also filter by work process number or by table name to trace all the sentences executed against a single or group of tables.

Most of times a combination of user name and transaction name or program name is used.

Once we have choosed the required filters we confirming with the green tick (red circle in the screeshot).  We will see then this screen where we have the date and time our trace first started (17.07.2015 09:40:06)

4.png

HOW TO STOP/DEACTIVATE ST05 TRANSACTION

Once transaction ZM08 has finished

5.png

we deactivate the trace

6.png

And then we display the trace

7

By default it will show you the last scheduled trace timing in “Trace Period”. Anyways if we are doing several traces in a row we can choose the date/time to display

8.png

We can also change the “Trace Type” and “Restrictions”. To continue we click the green tickon left top.

If the number of records on our trace is more thatn 5000 rows a new prompt window will show up asking if you want to continue : YES

We will have something like this with all the statements executed ordered by the time sequence

9.jpg

We can order the output by “Runtime” column to see the expensier statements of this transaction.

10.jpg

OTHER ST05 utilities

1) If you want to save the trace info / delete a saved trace or display it

trace.png

to save the trace used for the example

13

2) Top menu options for each statement

14.png

In our test

15.jpgThe query plan

16.png

If we want to find out what was the execution plan when this query was executed somethimes its possible to find it in st04> performance> History > SQL Statement History and search the date and time of this executions

17.jpg

3) Different options to display the info

18.png

Summarize Trace by SQL Statement : Combines the times for all the executions of a SQL statement . This is usually one of the best options to start our analysis.

19.JPG

Display Identical Selects: Combines the times for all the executions of a SQL statement  with the same values ( e.g. values in where clause)

20.JPG


ST12 Trace-how to use it for analysis

Analysis using ST12 Trace

Illustration

The ST12 trace analysis will follow the below mentioned steps,

  • Selection of Trace Parameters
  • Start and Collect Trace
  • Analyzing the Collected Trace

Trace Parameters

The Trace parameters can be categorized as below,

·         Trace For
.         Type of Trace

Trace For

·       ST12 trace can be captured for “User/Tasks”, “Work Process”, “Current Mode” and “For a Schedule”

·       The User/Tasks allows the developer to select a User for whom the trace is to be captured and a task for which the trace is to be captured. Task can vary from Dialog, batch etc. Selecting * in Tasks indicate all the tasks will be captured.        

1_247239

·         The Workprocess allows to select the server for which the trace is to be captured. In general all the servers will be captured when not specified.

2_247240

·    The Current Mode option is used trace the flow of a Transaction or a Program

3_247241

·    The Schedule option is used to run the trace for a batch job for a varied selection criterion as Job name, User name, Program associated with the Job

4_247242

Type of Trace          

ST12 trace can be initiated as an ABAP Trace or Performance trace or both. Setting the Size&Duration Parameter to MAX as highlighted will ensure that the whole trace is captured in case the trace extends to a long duration.

5_247243

Start and Collect of Trace

            Let us assume that the trace is to be taken for flow associated with checking the Info type 0001 data of a user through PA20.

·         First set the required Trace parameters. Let us select User/Task option by giving the Comment, User Name, and Task type as *. And select Start Trace

6_247244

·         Now open the transaction PA20 and give in the Person number and the Info type and select on Overview button highlighted below,

7_247245

·         Now Select End Trace in the ST12 trace screen, this will take us to the collect trace screen. Click on the execute button to collect the trace details. Make sure the highlighted check box is unchecked if the trace is to be used for future analysis.

8_247246

Analyzing the collected trace

Once the trace is collected the trace is ready for analysis. In the bottom pane as highlighted, select the Trace which is of concern to us

9_247251

Then select either one of the 4 highlighted options for the analysis

ABAP Trace

·         The ABAP trace is one of the most useful analysis options available in ST12 trace. It provides a Top Down flow of any Hotspot/Program/Transaction and provides a Functional Time Distribution of a flow. It displays the hierarchical order in which the call statements are executed. So it can be used to identify the issues in the flow hierarchy.

1_247252

·         The above screenshot is a Per Call View of the ST12 trace. The view can be changed into a Modularized by selecting the Per Mod Unit button as highlighted above. This will give a modularized flow of the Code called inside a particular module.

2_247253

·         The “Top Down Call Tree”(as highlighted below) option clicked when the cursor placed on a Modularization Unit Call(Method/Performs) displays all calls to the selected unit labeled as ‘0’,’1′ are statements inside this modularization units, ‘2’ the statements in modularization units one level below, and then iteratively down up to 30 levels. Letters are used to designate lower levels.

3_247254

·         Double clicking on any of the line navigates us to the source code. This can be used to identify the impact point.

·         ST12 trace captures the minute details of the flow such as the Loop statements performance, which can be used for a detailed analysis of the flow.

4_247255.png

·         As the ABAP trace captures the complete flow, this can be used as an effective tool to identify the Customer Modifications or User Exit.

Note: The call hierarchy considers the call on Forms, Methods, Functions, SQL statements, Loops, Call Screen to PBO, PAI Modules.

Comparison of ST12 with ST05 trace

ST12

ST05

Traces only a specific user context or a transaction Traces every action of a user on a server
ST12 trace automatically turns off with a transaction ST05 trace has to be manually turned off
Stores the trace into database and is permanent Stores the trace into local files and overwritten regularly
Provides a Top-Down flow used to find performance hotspot, issues identified by which are usually solved by code changes. Provides a bottom-up flow which is suitable for identifying DB bound performance issues, which are usually solved by Performance Tuning.

Performance Trace

Performance trace of ST12 is equivalent to the ST05 trace. It displays performance parameters of all the database statements executed in the flow.

5_247256

SQL Summary

SQL summary provides the details like Execution time, No. of records selected, Total duration, server details, etc. on a query on a database table. Double clicking on any record takes the flow to a screen which displays the list of programs which has queried on the table and the SELECT query as such

6_247258

Statistical Records

The statistical records display the time related parameter of a particular transaction flow.

7_247259

How to create traces in SAPconnect issues to get more information Skip to end of metadata

Introduction

While using SAPconnect interface to send or receive send requests (faxing, mailing, etc.), problems can occur due to
-Software bug
-Wrong configuration
-Interaction with other external communication partners (like fax or mail servers).

To get more information about the problem and to identify the location of the possible cause some useful tracing options are available in SAP.
Take into account, that these tracing methods are helpful if the send request reached the outbound (transaction SOST) or inbound (transaction SOIN) queue.

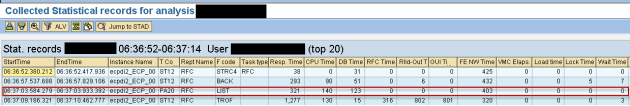
List of most common scenarios and advised tracing options:

-Outgoing send request through SMTP node not sent: check point 1, 2
-Outgoing send request through SMTP node sent with incorrect attributes/content: check point 2, 3
-Outgoing send request through RFC node not sent: check point 1
-Outgoing send request through RFC node sent with incorrect attributes/content: check point 1, 4
-Incoming send request through SMTP not received: check point 5
-Incoming send request through SMTP received with incorrect attributes/content: check point 3

  1. SAPconnect trace

It can be activated for outgoing and incoming send requests also:
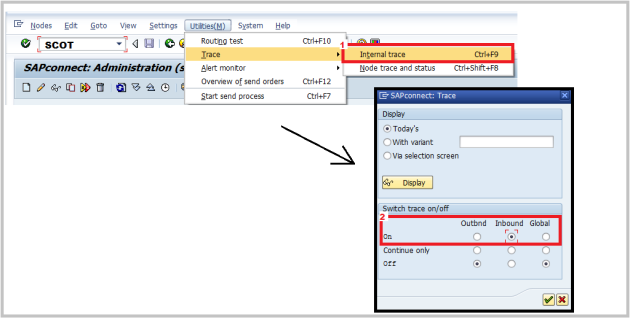
-Transaction SCOT
-Menu: Utilities > Trace Settings (in SAP Basis version 700 and higher)
OR
Menu: Utilities > Trace > Internal Trace (in SAP Basis Versions lower than 700)

For more info to create sapconnect trace read the sap note 194926.

After activating the trace reproduce the steps which led to the problem or resend the incorrect send request with button “Repeat send” in transaction SOST.

Trace can be checked for outgoing send requests as follows:
-Transaction SOST
-Select the appropriate send request
-Push button “Trace”
-Double click on the line “Trace ID”

Trace can be checked for incoming send requests as follows:
-Transaction SOIN
-Select the appropriate send request
-Push button “Trace”
-Double click on the line “Trace ID”

Display the list containing all sapconnect traces:
-Transaction SCOT
-Menu: Utilities > Trace Selection (in SAP Basis version 700 and higher)
OR
Menu: Utilities > Trace > Internal Trace >> Button “Display”

  1. ICM Trace

If send request goes through SMTP service, the ICM trace can also help to identify the problem.

Steps for creating ICM Trace:
-Transaction SMICM
-Menu: Goto > Trace File > Reset (deleting the trace to have the most current trace)
-Menu: Goto > Trace Level > Set
-New Trace Level: 3
-Button “Change”
-For outgoing mail: create a new send request (mail, fax, sms) and send it or resend (button “Repeat Send”) an existing, failed send request from transaction SOST.
In any case use the button “Start send proc. for selection” in tr. SOST for manually executing the send process on the appication server, where the icm trace was activated (icm trace is application server dependent)
-For incoming mail: from mail client (Outlook, Lotus Notes, etc.) send a mail into SAP System
OR send a test mail via telnet test into SAP System as of point 5 (Telnet test, SAP Note 607108).

Keep in mind, that this trace can increase rapidly. So after activating the trace reproduce the error immediately. Afterwards set the trace level back to 1 (default value).
See this page for instructions for the ICM trace analysis.

  1. MIME Representation

Using SMTP node, send request attributes/content can be checked with MIME representation.

Activate MIME creation as follows:
-Transaction SE38
-Execute report RSCONN06
-Set checkbox “Always Save” based on the situation (incoming or outgoing send request)

Afterwards create a new send request and send it to the recipient.
(either from SAP to an external recipient or from outside to an SAP system)

Displaying MIME representation for outgoing send request:
-Transaction SOST
-Click right mouse button on the newly created send request
-Choose “Display MIME Representation”
Displaying MIME representation for incoming send request:
-Transaction SOIN
-In last column “MIME exist” click on the icon “Dispaly MIME”

  1. SXDUMP Trace

For checking documents sent through RFC node, create the SXDUMP traces as of sap note 320503.

Important informations regarding SXDUMP:
-Create SXDUMP node in transaction SCOT with same settings/attributes, as the original node
-For SXDUMP node set a specific recipient address in address area, so that the send request with this recipient goes through the SXDUMP node
-Create an RFC destination in transaction SM59, which calls sxdump.exe on frontend
-Send process should be started manually from transaction SOST by the user, who installed sxdump.exe file on own PC. SXDUMP files will be created on this PC with the configured target file types, like TXT, PDF, etc.

  1. Telnet Test

For problems receiving send requests in SAP system through SMTP node, the telnet test is a useful method to check whether or not the SAP system is able to receive mails.
For telnet test check sap note 607108.
If the telnet test is successfull, the system is correctly configured to receive mails.

Enabling SAPconnect (SMTP) trace

You may need to enable SAPConnect trace to trouble shoot SMTP related issues or to send it to SAP for analysis.

How to enable SAP Connect (SMTP) trace?
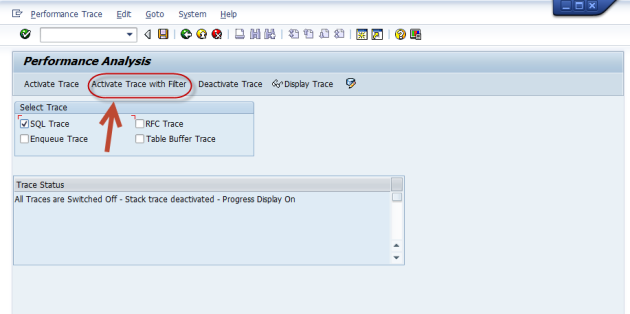
1. Log into SAP transaction SCOT.
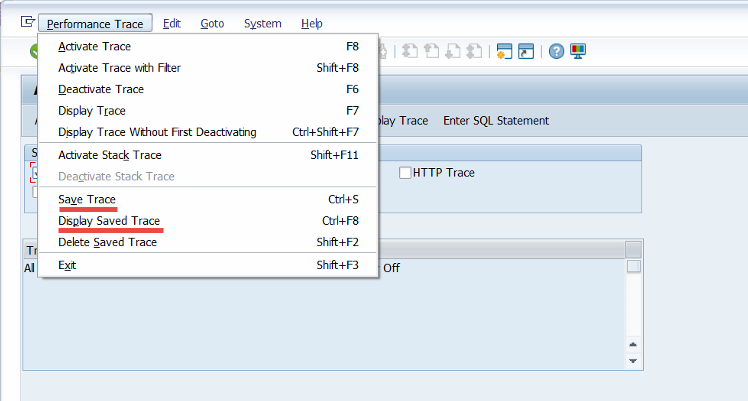
2. Now go to ” Utilities” > “Trace” > “Internal Trace ” (on SAP Basis Versions lower than 700) , for higher release go to ” Utilities” > “Trace Settings”.
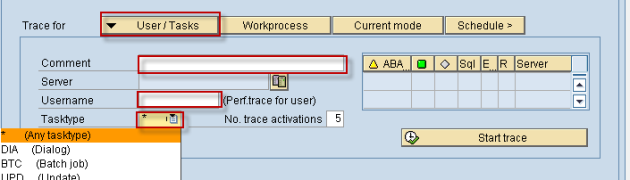
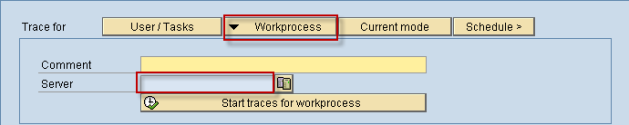
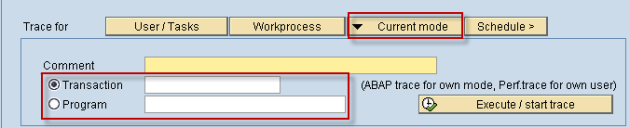
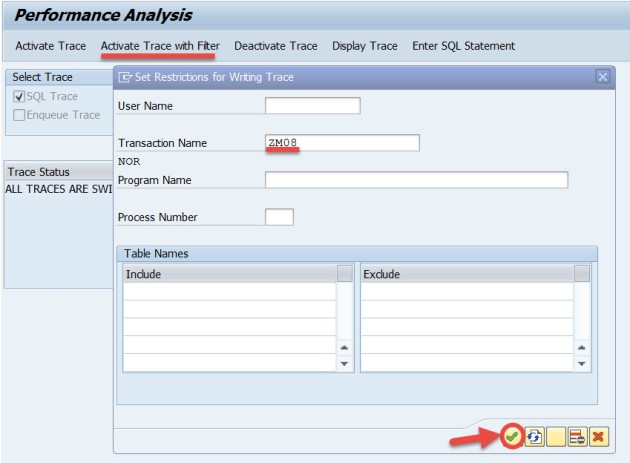
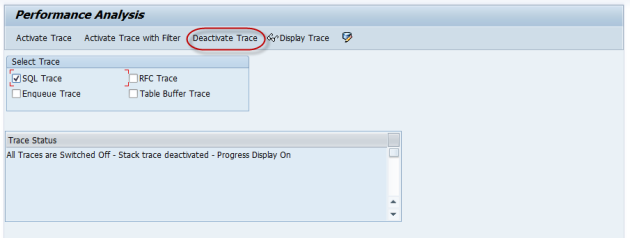
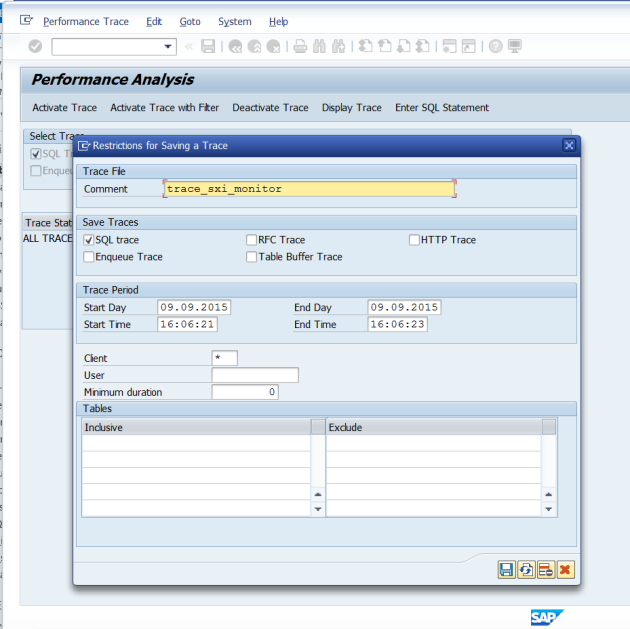
3. You will get screen as shown below , under section “Switch Trace On/Off” select the activity you want to trace (Inbound ,outbound or Global) and press enter.

SCOT_Enable_Trace.png

4.After activating the trace, reproduce the steps which led to the problem or resend the incorrect send request with button “Repeat send” in transaction SOST.
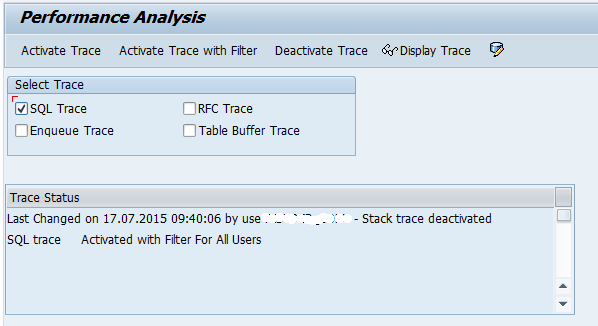
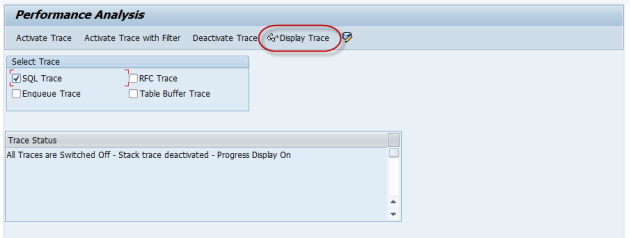
5. Once your activity is done ,switch off the trace , you can view the trace by selection the “Today’s” radio button in Display section .(As shown above).
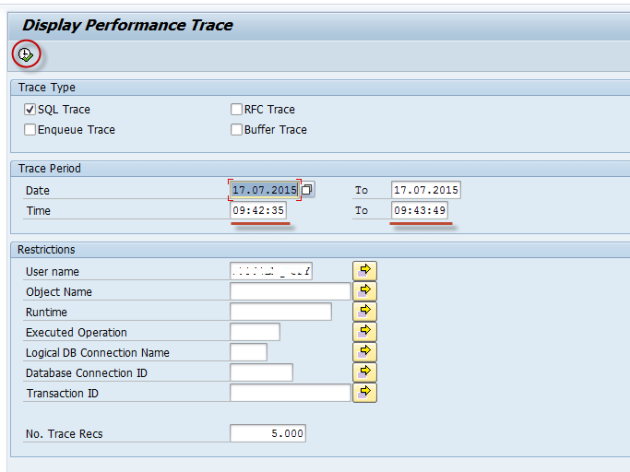
6. Once you press “Display” after selecting appropriate radio button under “Display” section , you will get a list of trace .
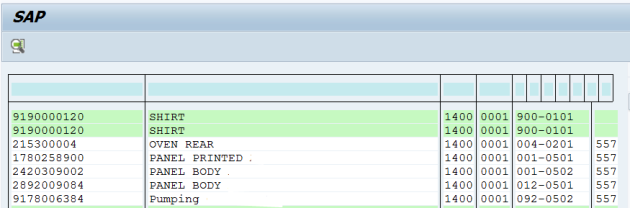
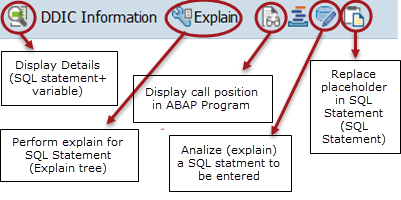
7.Select the trace you want to analyze , below is a example of sample trace output

Display_SAPconnect_Trace

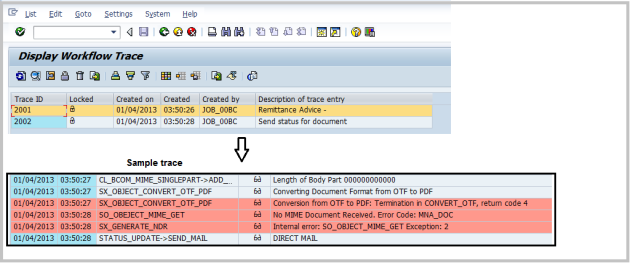
If you want to send a trace to SAP for analysis, mark the trace in the trace catalog/List and select the menu “Edit > Download Trace“. Allocate a <file name>.bin and zip it,then send the file to SAP.
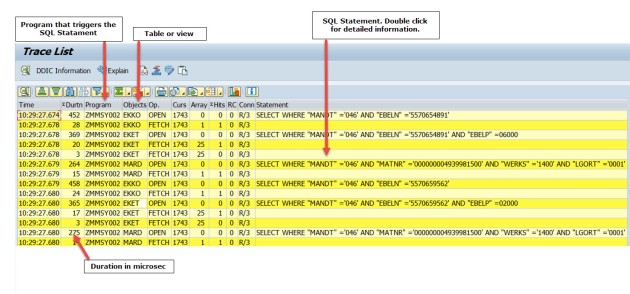
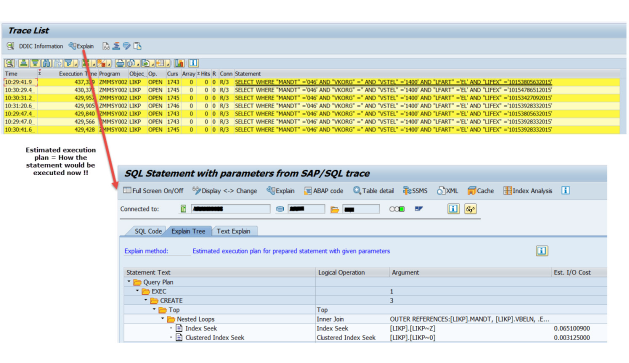
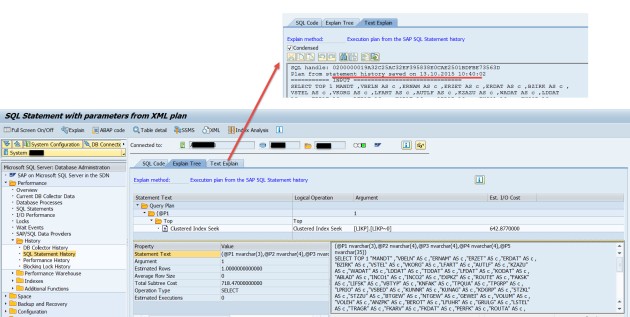
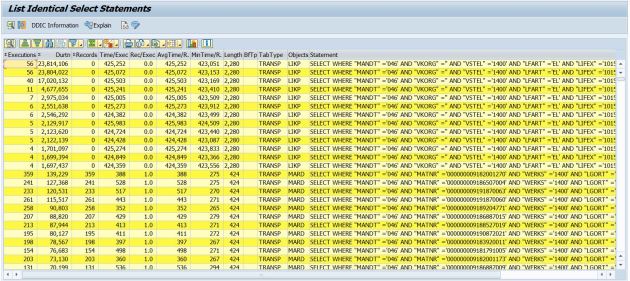
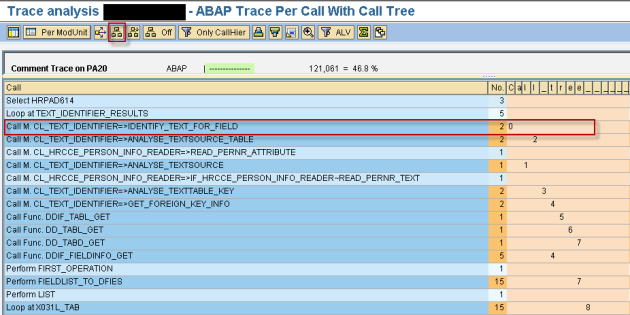
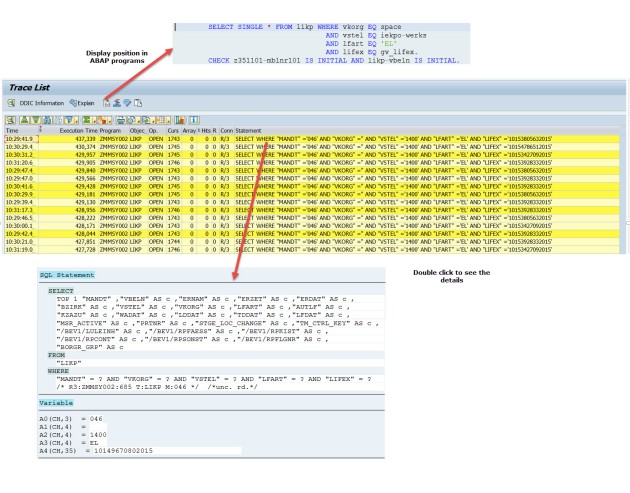
source:https://wiki.scn.sap.com/wiki/display/SI/How+to+create+traces+in+SAPconnect+issues+to+get+more+information